How do we know?
A curve drawn on a volcano, 25,000 weather stations, and bubbles of ancient air.
The Keeling Curve
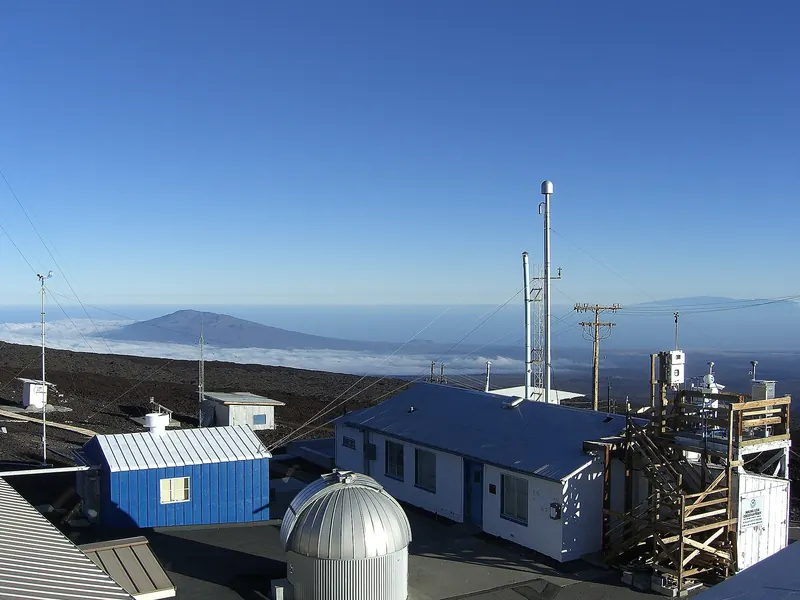
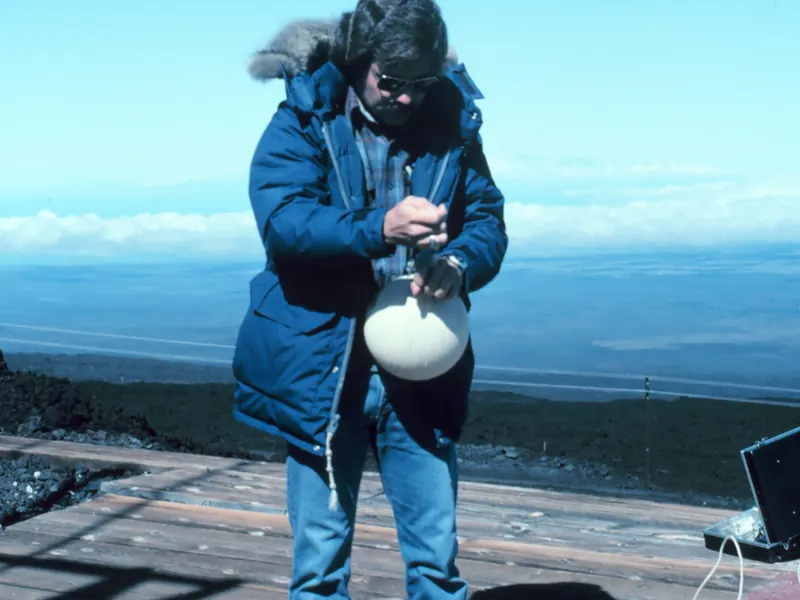
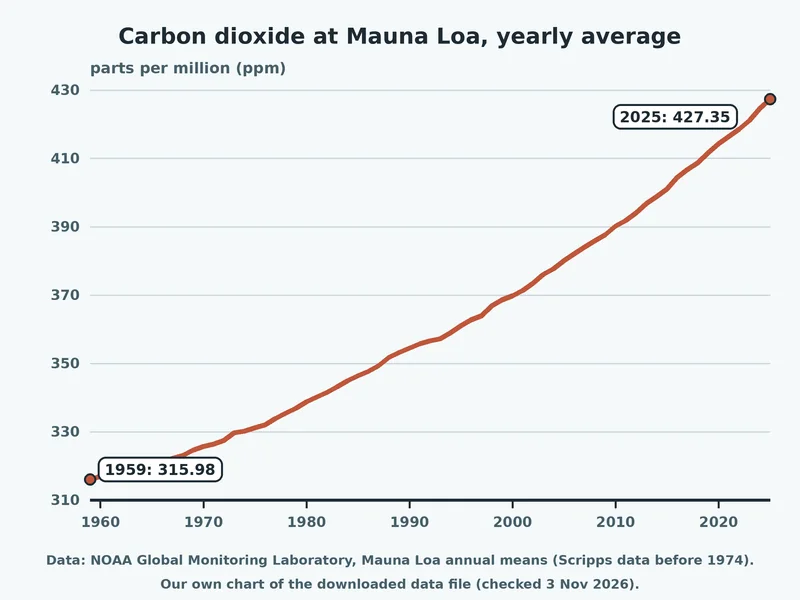
The Keeling Curve, devised by Charles David Keeling of the Scripps Institution of Oceanography, charts carbon dioxide at Mauna Loa since 1958. Encyclopaedia Britannica: Keeling Curve It is the longest unbroken instrument record of carbon dioxide in the world. Encyclopaedia Britannica: Keeling Curve
Keeling chose Mauna Loa and the South Pole because they were far from big carbon dioxide sources such as cities. Encyclopaedia Britannica: Keeling Curve
Measurements at Mauna Loa paused briefly in spring 1964 because of funding problems, and in 2022 because of the Mauna Loa eruption. Encyclopaedia Britannica: Keeling Curve
At Mauna Loa the highest reading each year comes in May, because Northern Hemisphere plants take in carbon dioxide as they grow in summer and release it as they decay in winter. NOAA Climate.gov (archived June 2025): Atmospheric carbon dioxide
Carbon dioxide: the numbers
“Parts per million” means the number of carbon dioxide molecules in every million molecules of dry air. NASA: Carbon dioxide (vital sign)
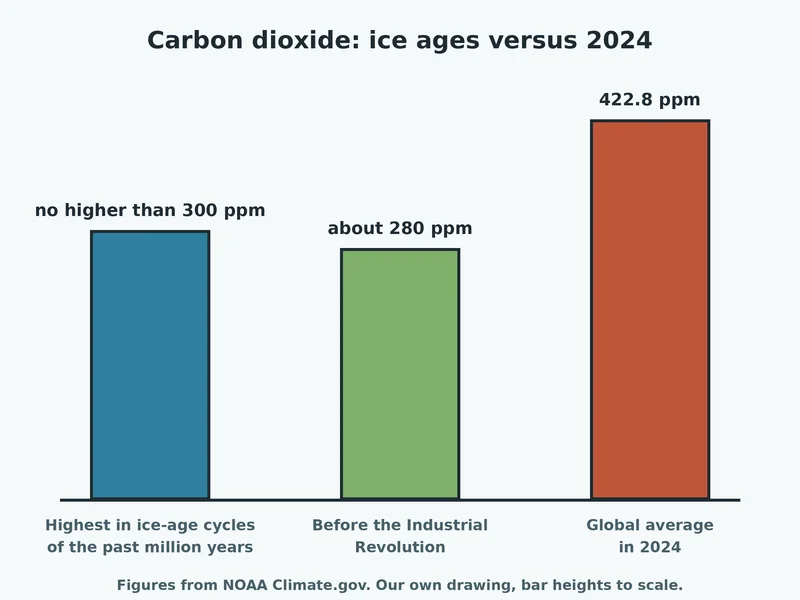
Global average carbon dioxide reached 422.8 parts per million in 2024, a new record. NOAA Climate.gov (archived June 2025): Atmospheric carbon dioxide The rise during 2024 was 3.75 ppm, the largest one-year increase on record. NOAA Climate.gov (archived June 2025): Atmospheric carbon dioxide
The yearly average at Mauna Loa Observatory, Hawaii, was 424.61 ppm in 2024. NOAA Climate.gov (archived June 2025): Atmospheric carbon dioxide NOAA’s yearly averages for Mauna Loa run from 315.98 ppm in 1959 to 427.35 ppm in 2025. NOAA Global Monitoring Laboratory: Mauna Loa CO2 annual mean data (text file)
The yearly rise was about 0.8 ppm in the 1960s and has sped up to 2.6 ppm a year in 2015–2024. NOAA Climate.gov (archived June 2025): Atmospheric carbon dioxide
Carbon dioxide is now 50% higher than before the Industrial Revolution. NOAA Climate.gov (archived June 2025): Atmospheric carbon dioxide
Air from the ice ages
Ice cores from Antarctica hold tiny bubbles of ancient air, extending the carbon dioxide record back through Earth’s last three glacial cycles. NASA: Carbon dioxide (vital sign)
Air bubbles in ice cores show carbon dioxide never went above 300 ppm in the ice-age cycles of the past million years or so, and it was 280 ppm or less before the Industrial Revolution. NOAA Climate.gov (archived June 2025): Atmospheric carbon dioxide
In just the last 800,000 years there have been eight cycles of ice ages and warmer periods. The last ice age ended about 11,700 years ago. NASA Science: Evidence
Over the past 60 years carbon dioxide has risen 100 to 200 times faster than at the end of the last ice age. NOAA Climate.gov (archived June 2025): Atmospheric carbon dioxide Carbon dioxide from human activities is rising about 250 times faster than it did from natural sources after the last ice age. NASA Science: Evidence
Clues from ice cores, tree rings and ocean sediments show today’s warming is roughly 10 times faster than the average warming after an ice age. NASA Science: Evidence
The temperature record
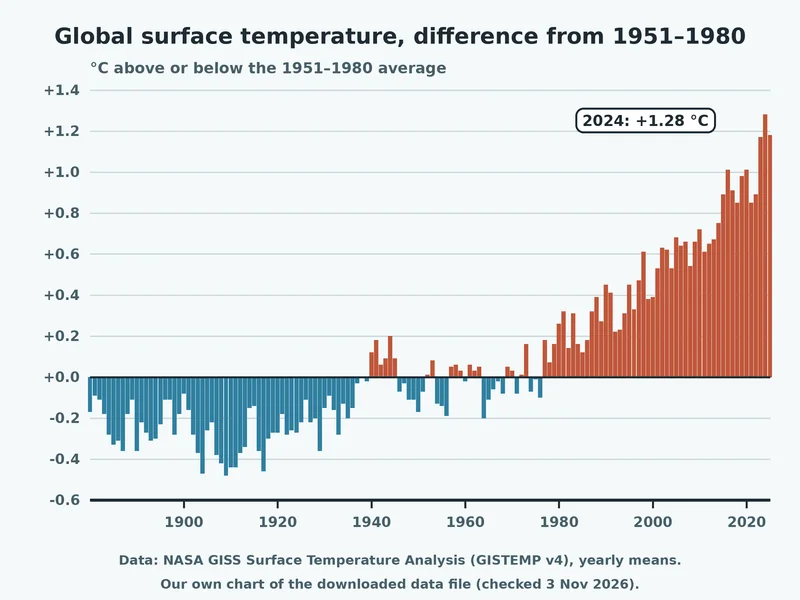
NASA’s analysis uses more than 25,000 weather stations, plus ship and buoy readings of sea temperature and Antarctic research stations. NASA: Global temperature (vital sign)
Since record-keeping began in 1880, the hottest year in NASA’s record is 2024. NASA: Global temperature (vital sign) The 10 most recent years are the warmest on record (NASA). NASA: Global temperature (vital sign)
In 2025 the global surface temperature was 1.19 °C above the 1951–1980 average, slightly cooler than 2024. NASA: Global temperature (vital sign) In NASA’s GISTEMP data, 2024 stands 1.28 °C above the 1951–1980 average, the highest yearly value since 1880. NASA GISS: GISTEMP v4 global annual mean data (CSV file)
NOAA says Earth has warmed by about 0.06 °C a decade on average since 1850, and more than three times as fast, 0.20 °C a decade, since 1982. NOAA Climate.gov (archived June 2025): Global temperature
By 2024 it had been 48 years since Earth last had a cooler-than-average year in NOAA’s record. NOAA Climate.gov (archived June 2025): Global temperature When 2005 set a new record it was the first of the new century to do so. It now ranks only 13th-warmest. NOAA Climate.gov (archived June 2025): Global temperature
Want to read the numbers for any year? Try the Data Explorer.
Next: the effects →